Physicochemical and Bacteriological Assessment of Treated and Untreated Water from Ahmadu Bello University Zaria Water Treatment Plant
-
Moses Adondua Abah


Department of Biochemistry, Faculty of Biosciences, Federal University Wukari, Taraba State, Nigeria
Umar MusaDepartment of Biology, Faculty of Life Sciences, Ahmadu Bello University, Zaria, Kaduna State, Nigeria
Richard Akacha JoshuaDepartment of Biology, Faculty of Life Sciences, Ahmadu Bello University, Zaria, Kaduna State, Nigeria
Elijah Nehemiah KamaDepartment of Medical Laboratory Science, University of Maiduguri, Borno State, Nigeria
Daniel Ebubechi ObasiDepartment of Medicine and Surgery, Faculty of Clinical Sciences, University of Ibadan, Oyo State, Nigeria
Akon Ekpenyong UsohDepartment of Applied Biology, Faculty of Biological Sciences, Bayero University Kano, Kano State, Nigeria
Patrick Chimuanya EtusDepartment of Microbiology, Faculty of Sciences, Imo State University, Imo, Nigeria
Sunday Agbo OkabeonyeDepartment of Applied Biology and Biotechnology, Faculty of Biological Sciences, Enugu State University of Science and Technology, Nigeria
Bolade Sunday AgbanigoDepartment of Dental Surgery, College of Medicine, University of Ibadan, Oyo State, Nigeria
Ufuoma Blessing AgbanigoFaculty of Clinical Science, College of Medicine, University of Ibadan, Oyo State, Nigeria
Wasiu Adegoke AderogbaDepartment of Oral and Maxillofacial Surgery, Faculty of Dentistry, Federal University of Health Sciences, Azare, Bauchi State, Nigeria
layemi Stephen BakareDepartment of Computer Science, School of Computing and Engineering Sciences, Babcock University, Ogun State, Nigeria
Agbam Chioma JulietDepartment of Microbiology, School of Life Sciences, Federal University of Technology Akure, Ondo State, Nigeria
| Received 17 Nov, 2025 |
Accepted 22 Feb, 2026 |
Published 23 Feb, 2026 |
Background and Objective: Water sources, whether surface or groundwater, are increasingly exposed to contaminants due to anthropogenic activities. Assessing the quality of water from the Ahmadu Bello University (ABU) Zaria Water Treatment Plant is essential to ensure its safety for drinking and recreational purposes. This study aimed to evaluate the physicochemical and bacteriological properties of treated and untreated water from the plant, assessing the efficacy of the treatment process in meeting international water quality standards. Materials and Methods: Water samples were collected from both treated and untreated sources at the ABU Zaria Water Treatment Plant. Physicochemical parameters analyzed included pH, temperature, electrical conductivity (EC), total dissolved solids (TDS), dissolved oxygen (DO), biological oxygen demand (BOD), alkalinity, chloride, nitrate, and phosphate. Bacteriological analysis focused on total coliform counts and the presence of specific pathogens such as E. coli, Klebsiella sp., and Proteus sp. The data were analyzed using descriptive statistics, and significance was tested (p>0.05). Results: Both treated and untreated water samples met the WHO pH standards (8.07-8.12). Temperature remained within ambient levels. Treated water exhibited higher EC (228.33 μS/cm) and TDS (114.17 mg/L) compared to untreated water (168.67 μS/cm and 84.17 mg/L, respectively). DO levels were significantly higher in treated water (2.28 mg/L) than in untreated water (0.93 mg/L). The BOD was lower in treated water (1.18 mg/L) compared to untreated samples (0.47 mg/L), indicating effective reduction of organic matter. Alkalinity, chloride, nitrate, and phosphate levels showed minimal variation between treated and untreated samples. Total coliform counts were substantially reduced in treated water (0-7) compared to untreated water (31-65). Despite treatment, E. coli, Klebsiella sp., and Proteus sp. were still detected in some samples. Conclusion: The treatment process at ABU Zaria Water Treatment Plant effectively improves most physicochemical and bacteriological parameters, aligning with WHO standards. However, the detection of pathogenic bacteria in treated water highlights the need for further enhancement of treatment protocols to ensure complete safety for human consumption.
| Copyright © 2026 Abah et al. This is an open-access article distributed under the Creative Commons Attribution License, which permits unrestricted use, distribution, and reproduction in any medium, provided the original work is properly cited. |
INTRODUCTION
Every living thing, from plants to animals, requires water to survive1,2. As a result, everyone should have access to clean drinking water. Water needs to be wisely managed and conserved since it is a major source of drinking water for people worldwide, especially in rural regions3. Safe drinking water must meet acceptable standards for physical, chemical, and bacteriological criteria. These metrics have been applied globally to assess the overall quality of drinking water4. Several factors, including the sanitary state of storage, may contribute to the deterioration of water quality between sources and points of use5,6. Water quality has been found to have significantly declined while being stored at residences in Latin America, Africa, and Asia7,8. In fact, water storage for days may cause water quality deterioration and become unsuitable for drinking9. Worldwide, 1.5 billion people do not have access to clean water, and almost 1.8 million people in poor nations lose their lives each year as a result of water-related illnesses and poor sanitation10. Even if the locals know the water isn’t safe to drink, they often have to make do with what they have because of financial constraints and, more likely, a lack of access to water purification systems. There are thousands of cholera cases reported every year in Nigeria. Diseases caused by gram-negative parasites include cholera-causing Vibrio cholera, dysentery-causing Shigella dysenteriae, Salmonella enteritis, tuberculosis-causing Mycobacterium tuberculosis, and typhoid fever-causing Salmonella typhi. Hepatitis A, polio, and enteroviruses are among the viruses that cause worry. Protozoans such as Giardia lamblia and Entamoeba histolytica can be found in water and can cause diseases such as amoebiasis and giardiasis, respectively11.
Humans cannot function physiologically or survive without access to potable water. Taking into account the earth’s fresh water supply, the rising demand for it in households and businesses, and the rate of population expansion, humanity is confronting a water crisis12. Additionally, human activities are polluting it, which in turn reduces the supply of drinkable water13. People are trying to find solutions to the water problem by finding ways to purify dirty water or save the limited amount of clean water for later use. When water is stored, the number of organisms in it tends to decrease. The microbiological composition of stored liquids is influenced by multiple factors. Sedimentation, biological processes, light, temperature, and food availability are all factors to consider14. How well water is treated, where it comes from, and how long it stays stored all contribute to its overall purity15. Basically, water is as important as food in the nutrition of man and must be supplied regularly and in sufficient quality and quantity. Water is needed in the body for digestion, translocation, absorption, and excretion of metabolic waste, secretion of hormones, enzymes, and other biochemical body functions16. Though a water supply may pass all laboratory tests, we have to bear in mind that hazards may arise from pollution of the water source through cross-connection, back-siphonage, leaks in mains and service reservoirs17. Water of good quality has a low total bacterial count of fewer than 100 cfu per milliliters18. Since safe drinking water is essential for good health, drinking water must be free of pathogens.
Ahmadu Bello University Water Treatment Plant (ABUWTP) is a water treatment plant that uses water from the Kubanni Dam to provide portable water to over 70,000 people. The treatment process includes prechlorination, coagulation, filtration, and disinfection. The plant supplies 1,840,000,000 liters of portable water per day, which is distributed to the residents of the main campus of Ahmadu Bello University in Zaria19. Different research works have been carried out on various sources of water over the years. Water, either from surface or ground source, is being continuously exposed to contaminants through man’s activities. Therefore, the quality of water from the ABU Water Treatment Plant and its suitability for drinking and recreational purposes is essential for addressing public health concerns in the region. This study investigated the physicochemical and bacteriological quality of both the untreated and treated water supplied from the ABU Water Treatment Plant.
MATERIALS AND METHODS
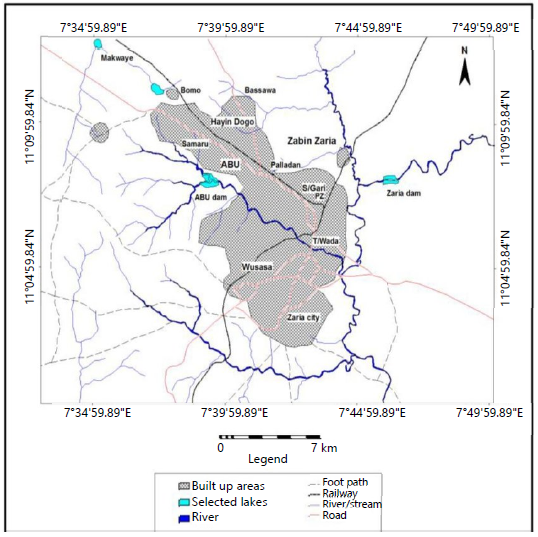
Study area: The study area for this research was Ahmadu Bello University water treatment plant, which is located within the university premises, at an elevation of 655 meters, at Latitude 11°08’ 25.60” N and Longitude 7°39’ 19.65” E, as shown in Fig. 1. The research began in May 2023 and was completed in October 2023.
Sample collection: Water samples used for this study were collected from the ABU Zaria Water Treatment Plant during the rainy season, from August through mid-September. The samples were collected weekly in sterilized plastic bottles and transported to the laboratory in polythene bags. The samples were analyzed for physicochemical parameters using standard methods within two hours of collection, except for bacteriological analyses, which took longer. The analysis of the samples was done using standard methods to ensure the accuracy and reliability of the results.
Physicochemical analysis: Physicochemical parameters of the obtained water samples examined include pH, temperature, electrical conductivity (EC), total dissolved solids (TDS), dissolved oxygen (DO), biochemical oxygen demand (BOD), alkalinity, chloride, nitrate, and phosphate, which were measured using standard methods20.
Temperature: The temperature of the water samples was measured in degrees Celsius (°C) using a Hanna instrument. The electrodes of the instrument were dipped into 50 mL of water in a 100 mL beaker, and the temperature was allowed to stabilize for 1 min before a reading was taken.
|
pH: The pH of the water samples was measured using a Hanna instrument, with distilled water as the blank. As 50 mL of water sample was transferred into a 100 mL beaker. The electrode of the instrument was dipped into the water sample, and the pH was recorded when a stable reading was reached.
Electrical conductivity: The electrical conductivity (EC) of the water samples was measured using a Hanna instrument. The electrode was dipped into 50 mL of the water sample in a 100 mL beaker, and the EC was recorded in micro-siemens per centimeter (μS/cm).
Dissolved oxygen: Dissolved oxygen of the water samples was determined by filling 300 mL BOD bottles to the maximum with the water samples, and air bubbles were avoided. As 2 mL of MnSO4 solution and 2 mL alkali-azide reagent were added and properly mixed by inverting the bottles. One-third (1/3) of the floc was allowed to settle down, and it was then mixed for the second time and allowed to settle again. As 2 mL of concentrated Sulphuric Acid (H2SO4) was added to the floc. The BOD bottles were stoppered and inverted gently. After the dissolution was complete, 200 mL of the mixture was taken into a 250 mL conical flask, 1 mL of starch was added, and then titrated with 0.0125N Thiosulphate solution. The milliliters of sodium thiosulfate used were recorded.
Biological oxygen demand (BOD): Biological Oxygen demand of the water samples was determined by calculating the difference between dissolved oxygen over a 5-day incubation interval:
Where:
| DO1 | = | Dissolved oxygen value for day one | |
| DO5 | = | Dissolved oxygen value after five days of incubation |
Total alkalinity: Total alkalinity was determined by adding 2 drops of Bromocresol green and 2 drops of methyl red to 100 mL of the sample in a conical flask. The solution was titrated against 0.02 mg/L sulphuric acid, and the total alkalinity was calculated as:
Nitrate determination: Nitrate-Nitrogen was determined by evaporating 100 mL of each water sample to dryness in a metallic crucible. Phenol disulphonic acid (2 mL) was added to the residue, which was swirled for uniformity and left for 10 min. Distilled water (10 mL) was added, followed by strong ammonia solution (5 mL). The color change was read at a wavelength of 430 nmλ.
Phosphate determination: To 100 mL of each water sample in a 250 mL conical flask, 1 mL of ammonium molybdate was added. This was followed by the addition of about 4-5 drops of stannous chloride reagent. It was allowed to stand for about 12 min. It was then measured at 600 nmλ with a calorimeter, using distilled water as a blank. The value of POP was read from the display panel of the calorimeter.
Chloride determination: To determine chloride, 100 mL of the water sample was measured into a 250 mL conical flask, followed by 2-3 drops of Potassium Chromate (K2CrO4). The content was swirled for a few minutes, then titrated against standard Silver Nitrate (AgNO3) until a dirty reddish precipitate formed. The concentration of chloride in the sample was calculated as follows:
Membrane filter technique: The glassware was sterilized in an autoclave at 121°C for 15 min. A sterile 0.45 μm membrane filter was placed in the filtration setup using flame-sterilized forceps. The 100 mL of each water sample was transferred into the filtration funnel and passed through the filter using a suction pump. The membrane filter was removed from the filtration setup and placed on petri dishes containing EMB agar with the grid side up. The membrane filter was allowed to make good contact with the EMB agar surface. Sterile buffer saline was used to rinse the filtration funnel after each sample filtration to prevent contamination. This process was repeated for all the samples.
Colony count: The petri dishes containing the membrane filters were incubated upside down in an incubator at 37°C for 24 hrs. The number of colonies on each membrane filter was counted using a colony counter and recorded as the number of colony-forming units per 100 mL of water (CFU/mL).
Subculture of isolates: A single colony from each membrane filter was streaked onto a fresh nutrient agar plate to obtain a pure culture of the different bacterial isolates. The plates were incubated for 24 hrs and the colonies to be identified were picked from the media.
Gram staining: A thin film of each bacterial isolate was prepared by placing a small amount of the growth into a drop of sterile distilled water on a clean, grease-free glass slide. The sample was spread across the slide using a sterile wire loop, then allowed to air-dry. The slide was fixed by briefly flaming it over a Bunsen burner. The slide was then stained with crystal violet for 60 sec, rinsed with water, and stained with iodine solution for another 60 sec. The slide was then rinsed with water and decolorized with alcohol. The slide was then counterstained with safranin for 30 sec. After rinsing with clean water, the slide was allowed to air-dry and viewed under the light microscope using oil immersion. Microscopic observation was done according to standard procedure21.
Biochemical tests
Citrate utilization test: The isolates were inoculated on Simmons' citrate agar slants in a test tube and incubated at 37°C for 24 hrs. The development of a deep blue color on the slant indicated a positive reaction, while no color change indicated a negative reaction21.
Indole test: The isolates were incubated in 5 mL of peptone water for 24 hrs. Afterwards, 3 drops of Kovac's reagent were added to each tube and gently shaken. A positive reaction was indicated by the development of a red color in the reagent layer above the broth, while a negative reaction was indicated by the retention of the yellow color of the reagent21.
Motility: The medium was inoculated with a fine stab to a depth of 1-2 cm below the surface of the medium, using a sterile needle. The inoculated medium was incubated at 35°C for 24 hrs. For motile organisms, the inoculated medium was cloudy, and the line of inoculation was not sharply defined. For non-motile organisms, the growth was confined to the line of inoculation, which was sharply defined, and the rest of the medium was clear21.
Methyl Red-Voges-Proskauer test: The isolates were grown in 5 mL of MR-VP broth and incubated for 48 hrs at 35°C. Afterwards, 1 mL of the broth was transferred to a sterile test tube, and 2 drops of methyl red indicator were added and mixed thoroughly. A positive test was indicated by an intense red color, while a negative test was indicated by a yellow color. To the remaining tubes, 5 drops of KOH were added, followed by 5 drops of 5% a naphthol in ethanol. The tubes were shaken and placed in a sloping position. A positive test was indicated by the development of a red color starting from the liquid-air interface within one hour. A negative test was indicated by no change in color21.
Triple sugar iron (TSI): The TSI agar slant was inoculated by a fine stab with a needle to a depth of 3-5 cm below the surface of the medium. The inoculated medium was incubated at 35-37°C for 18-24 hrs. After incubation, the reaction in the slant and butt is observed, as well as any gas and hydrogen sulfide production. Development of yellow colour indicates acid reaction; red colour indicates alkaline reaction; blackening of the medium indicate H2S production; and bubbles, cracks, or displacement of the medium indicate gas production.
Data analysis: The results were statistically analyzed using Analysis of Variance (ANOVA) operated through SPSS software to determine the variance of the physicochemical parameters of treated and untreated water. Results were considered significant at p<0.05.
RESULTS
Determination of physicochemical parameters of treated and untreated water samples: The mean pH levels in treated and untreated water samples were determined. The treated water exhibited a slightly higher pH of 8.12±0.25 compared to 8.07±0.21 in the untreated water, and there was no significant difference. There was no statistically significant difference (p>0.05) in the mean temperature of both treated and untreated water samples showed minor temperature variations, with treated water at 27.18°C and untreated water at 26.85°C. Treated water displayed higher electrical conductivity (EC) at 228.33 μS/cm compared to 168.67 μS/cm in untreated water, which indicates a significant difference (p>0.05). This elevated mean EC in treated water may be attributed to the presence of dissolved ions, potentially from the treatment process. TDS mean levels in treated water were 114.17 mg/L, whereas in untreated water, they were 84.17 mg/L, and there was a significant difference (p>0.05). The mean dissolved oxygen (DO) level of the treated water sample (2.28 mg/L) was significantly higher than that of the untreated water sample (0.93 mg/L), suggesting that the treatment process was effective in improving the water quality. The mean biological oxygen demand (BOD) concentration recorded for the treated water sample (1.18 mg/L) was significantly higher than that of the untreated water sample (0.47 mg/L). The difference in mean total alkalinity between treated and untreated water samples (5.83 mg/L) and (6.67 mg/L) was not significant. Treated water showed lower chloride levels (2.4 mg/L) compared to untreated water (2.87 mg/L), and there is no significant difference (p>0.05). The mean nitrate concentration of the treated water 14.75 mg/L, which was lower compared to 18.33 mg/L in untreated water indicate no significant difference (p>0.05). Treated water exhibited a slightly lower phosphate concentration of 1.18 mg/L compared to 1.28 mg/L in untreated water, and there is no significant difference (p>0.05) as shown in Table 1.
Bacteriological analysis of treated and untreated water samples: Table 2 shows a significant difference in the total coliform counts and colony forming units per 100 mL (CFU/100 mL) between the treated and untreated water samples. In the treated water samples, the highest count was in sample 1 with 7 total counts representing 0.7×101 CFU/100 mL, while the lowest count was in sample 3, which had no detectable coliforms. In the untreated water samples, sample 4 had the highest count, with 65 total counts representing 6.0×101 CFU/100 mL and sample 3, with 31 total counts had the lowest count representing 3.1×101 CFU/100 mL.
| Table 1: | Physicochemical parameters of treated and untreated water samples | |||
| Parameter | Treated water | Untreated water | t-statistic | p-value | WHO |
| pH | 8.12±0.25 | 8.07±0.21 | 0.34 | 0.7418 | 6.5-9.5 |
| Temperature (oC) | 27.18 | 26.85 | 1.26 | 0.2372 | Ambient |
| EC (μS/cm) | 228.33 | 168.67 | 2.79 | 0.0204 | 1000 |
| TDS (mg/L) | 114.17 | 84.17 | 2.83 | 0.0189 | 500 |
| DO (mg/L) | 2.28 | 0.93 | 10.44 | 0 | 7.5 |
| BOD (mg/L) | 1.18 | 0.47 | 8.3 | 0 | 7--9 |
| Alkalinity (mg/L CaCO3) | 5.83 | 6.67 | -0.78 | 0.4553 | 150 |
| Chloride (mg/L) | 2.4 | 2.87 | -1.59 | 0.1432 | 250 |
| Nitrate (mg/L) | 14.75 | 18.33 | -1.41 | 0.1938 | 50 |
| Phosphate (mg/L) | 1.18 | 1.28 | -0.46 | 0.6553 | 50 |
| Table 2: | Colony count and CFU/100 mL of treated and untreated water samples | |||
| Treated water samples | Untreated water samples | ||||
| Sample | Total count | CFU/100 mL | Sample | Total count | CFU/100 mL |
| 1 | 7 | 0.7×101 | 1 | 52 | 5.2×101 |
| 2 | 3 | 0.3×101 | 2 | 60 | 6×101 |
| 3 | 0 | 0 | 3 | 31 | 3.1×101 |
| 4 | 6 | 0.6×101 | 4 | 65 | 6.5×101 |
| 5 | 6 | 0.6×101 | 5 | 42 | 4.2×101 |
| 6 | 4 | 0.4×101 | 6 | 48 | 4.8×101 |
| CFU = Colony Forming units | |||||
| Table 3: | Biochemical tests on treated water samples | |||
| Sample | TSI | Citrate | Sulfide | Indole | Motility | MR | VP | Gram reaction | Organism |
| 1 | Acid/Acid+Gas | - | - | + | + | + | - | - | E. coli |
| 2 | Acid/Acid+Gas | + | - | - | - | - | + | - | Klebseilla sp. |
| 4 | Acid/Acid+Gas | - | - | + | + | + | - | - | E. coli |
| 5 | Acid/Acid+Gas | - | - | + | + | + | - | - | E. coli |
| 6 | Acid/Acid+Gas | + | + | + | - | + | - | - | Proteus sp. |
| TSI: Triple sugar iron test, MR: Methyl red test, VP: Voges-Proskauer test, +: Positive reaction, -: Negative reaction, Acid/Acid+Gas: Fermentation of glucose and lactose and/or sucrose with gas production and Gram reaction (−): Gram-negative bacteria | |||||||||
| Table 4: | Biochemical tests on untreated water samples | |||
| Sample | TSI | Citrate | Sulfide | Indole | Motility | MR | VP | Gram reaction | organism |
| 1 | Acid/Acid+Gas | + | - | - | - | - | + | - | Klebsiella sp. |
| 2 | Acid/Acid+Gas | + | - | - | - | - | + | - | Klebsiella sp. |
| 3 | Acid/Acid+Gas | + | + | + | - | + | - | - | Proteus sp. |
| 4 | Acid/Acid+Gas | - | - | + | + | + | - | - | E. coli |
| 5 | Acid/Acid+Gas | - | - | + | + | + | - | - | E. coli |
| 6 | Acid/Acid+Gas | + | + | + | - | + | - | - | Proteus sp. |
| TSI: Triple sugar iron test, MR: Methyl red test, VP: Voges-Proskauer test, +: Positive reaction, -: Negative reaction, Acid/Acid+Gas: Fermentation of glucose and lactose and/or sucrose with gas production and Gram reaction (−): Gram-negative bacteria | |||||||||
Table 3 and 4 show the results of biochemical tests performed on the bacterial isolates obtained from the treated and untreated water obtained from ABU Zaria water treatment plant. The results of the biochemical tests revealed the presence of E. coli in water samples 1, 4, and 5 for treated water and water sample 4, and 5 for untreated water; Klebsiella in water sample 2 for treated water and water sample 1, and 2 for untreated water; and Proteus in water sample 6 for treated water and water sample 3, and 6 for untreated water.
DISCUSSION
Humanity is facing water shortage considering its availability, domestic and industrial used which has been increasing with increased in population growth and the constancy of the earth fresh water22. To ensure the safety of drinking water, water quality guidelines establish thresholds for various parameters. Regularly monitoring the quality of drinking water is crucial as contaminants can lead to a range of waterborne illnesses. Access to clean water is indispensable for enhancing quality of life and preventing the occurrence of diseases.
This study investigated the physicochemical parameters of the treated and untreated water samples obtained from ABUWTP. The result upon investigation indicate that the mean temperature was 27.18°C for treated water and 26.18°C for untreated water, which is within the WHO's recommended range. This study is similar to research conducted by Abdul et al.1. The Biological Oxygen Demand (BOD), sedimentation, and chlorination processes, as well as the temperature of groundwater, tend to increase with increasing depth to the aquifer. pH value for treated water obtained is 8.12±0.25, while for untreated water is 8.07±0.21, respectively. These values fall within the WHO-recommended range of 6.5 to 9.5.
The treated water samples exhibited higher EC and TDS values compared to the untreated water (228.33 μS/cm; 114.17 mg/L and 168.67 μS/cm; 84.17 mg/L, respectively). This could be attributed to the treatment process, possibly involving the addition of chemicals. Despite this, both values are within the 1000 mg/L WHO drinking water standard. This study corresponds with the research work conducted by12. The difference in TDS shows how different allochthonous and autochthonous inputs contributed to the reservoir. Therefore, both the treated water and the reservoir water are potable in terms of electrical conductivity.
Dissolved oxygen may not directly endanger human health; it may have an impact on other substances present in the water23. The Dissolved Oxygen of both treated (2.28 mg/L) and untreated water (0.93 mg/L) readings is within the recommended range for drinking water. Odor issues can arise when dissolved oxygen in water supplies is reduced, as this can promote microbial conversion of nitrate to nitrite and sulphate to sulphide13. The Biological Oxygen Demand (BOD) obtained for both treated and untreated waters, with mean BOD values of 1.18 and 0.47 mg/L was within the recommended values14. The BOD is in line with the finding of old study15.
Alkalinity from this study was 5.83 mg/L CaCO3 for treated water and 6.67mg/L CaCO3 for untreated water. The total alkalinity of all the samples was found to be within the WHO limit of 150 mg/L CaCO3 of drinking water. This result is in line with the findings of Adeyeye et al.4 who reported similar results. The chloride levels of the treated and untreated water samples were 2.4 and 2.87 mg/L, respectively. These values are within the WHO-recommended level of 250 mg/L. This is consistent with the past research findings23.
Nitrate is one of the most important disease-causing parameters of water, particularly blue baby syndrome in infants. Nitrate gets into water through chemical fertilizers, soil, foods, glass, and explosives24. The mean nitrate concentration value of treated water was 14.75 and 18.33 mg/L in untreated water. These values also conform to the WHO permissible limit of 10 mg/L. This result is in agreement with that of the studies by Adeyeye et al.4. The phosphate concentration of treated water samples was 1.18 and 1.28 mg/L in untreated water samples. Phosphate levels are within the WHO limit of 50 mg/L for both treated and untreated water.
The bacteriological analysis reveals the presence of coliform bacteria in both treated and untreated water samples. The treated water samples had the highest total count in sample 1, with 7 total counts representing 0.7×101 CFU/100 mL, while the lowest count was in sample 3, which had no detectable coliforms. In the untreated water samples, sample 4 had the highest count with 65 total counts representing 6.0×101 CFU/100 mL, and sample 3, with 31 total counts, had the lowest count, representing 3.1×101 CFU/100 mL. The total coliform count in treated water is consistently lower than in untreated water across all samples. This demonstrates the effectiveness of the water treatment process in reducing coliform bacteria. The presence of coliform bacteria, including E. coli, Klebsiella sp., and Proteus sp., was identified in both treated and untreated water samples. These bacteria are indicators of fecal contamination and pose a significant health risk if consumed. This study corresponds with the research work conducted previously20, who found that the fecal coliforms isolated from the water samples were identified as E. coli, Enterobacter sp., and Klebsiella sp., and the levels of fecal coliforms in the raw water were higher than those in the treated water from ABUWTP.
CONCLUSION
The results for physicochemical parameters, including temperature, pH, EC, DO, BOD, TDS, total alkalinity, nitrate, and chloride, were all within the WHO-recommended range for drinking water. All treated water was not free from contamination, but the samples had low coliform counts that meet WHO standards of 1.0×10², which is the standard for total coliform count for drinking water, while untreated water samples were highly contaminated with coliform bacteria such as E. coli, Klebsiella sp., and Proteus sp. The presence of bacteria in the water should also not be overlooked since they can be pathogenic when consumed in large quantities over time.
SIGNIFICANCE STATEMENT
This study provides evidence-based evaluation of the efficiency of the ABU Zaria Water Treatment Plant in improving water quality to meet international standards. By identifying residual pathogenic contamination despite acceptable physicochemical parameters, the findings highlight critical public health implications and the need for strengthened treatment and monitoring strategies to ensure safe potable water supply.
ACKNOWLEDGMENTS
We acknowledge all authors of this research work for their participation.
REFERENCES
- Abdul, R.M., L. Mutnuri, P.J. Dattatreya and D.A. Mohan, 2012. Assessment of drinking water quality using ICP-MS and microbiological methods in the Bholakpur Area, Hyderabad, India. Environ. Monit. Assess., 184: 1581-1592.
- Abdulkareem, M.A., O.T. Omotunde, T.M. Momoh-Salami, O.J. Bamikole and T.H. Olajide, 2023. Bacteriological and physicochemical analysis of surface water; implications on public health. Biomed. J. Sci. Tech. Res., 51: 42879-42884.
- Enerijiofi, K.E., E.O. Olatunji and P.A. Irerua, 2018. Effect of human activities on the physicochemical and bacteriological qualities of Ujiogba River, Ujiogba, Edo State, Nigeria. J. Appl. Life Sci. Int., 17.
- Adeyeye, J.A., A.A. Adeyemo and T. Alonge, 2017. Physico-chemical characteristics of sachet waters in Ikole and Oye Local Government Areas of Ekiti State, Nigeria. FUOYE J. Agric. Hum. Ecol., 1.
- Cheesbrough, M., 2005. District Laboratory Practice in Tropical Countries, Part 1. 2nd Edn., Cambridge University Press, Cambridge, England, ISBN: 9780521676304, Pages: 462.
- Cronin, A.A. N. Breslin, J. Gibson and S. Pedley, 2006. Monitoring source and domestic water quality in parallel with sanitary risk identification in Northern Mozambique to prioritise protection interventions. J. Water Health, 4: 333-345.
- Adefemi, S.O., S.S. Asaolu and O. Olaofe, 2008. Determination of heavy metals in Tilapia mossambicuis fish, associated water and sediment from Ureje Dam in South-Western Nigeria. Res. J. Environ. Sci., 2: 151-155.
- Kumolu-Johnson, C.A., P.E. Ndimele, S.L. Akintola and C.C. Jibuike, 2010. Copper, zinc and iron concentrations in water, sediment and Cynothrissa mento (Regan 1917) from Ologe Lagoon, Lagos, Nigeria: A preliminary survey. Afr. J. Aquat. Sci., 35: 87-94.
- Ndimele, P.E., A. Jenyo-Oni, A.I. Ayodele and A.A. Jimoh, 2010. The phytoremediation of crude oil-polluted aquatic environment by water hyacinth (Eichhornia crassipes [Mart.] Solms). Afr. J. Livest. Ext., 8.
- Ndimele, P.E. and C.A. Kumolu-Johnson, 2012. Some aspects of the physicochemistry and heavy metal content of water, sediment and Cynothrissa mento (Regan, 1917) from Badagry Creek, Lagos, Nigeria. Trends Appl. Sci. Res., 7: 724-736.
- Uka, U.N., K.S. Chukwuka and F. Daddy, 2007. Water hyacinth infestation and management in Nigeria inland waters: A review. J. Plant Sci., 2: 480-488.
- Ndimele, P.E. and A.A. Jimoh, 2011. Water hyacinth (Eichhornia crassipes (Mart.) Solms.) in phytoremediation of heavy metal polluted water of Ologe Lagoon, Lagos, Nigeria. Res. J. Environ. Sci., 5: 424-433.
- Raskin, I., 1996. Plant genetic engineering may help with environmental cleanup. Proc. Natl. Acad. Sci. U.S.A., 93: 3164-3166.
- Olawale, O., M.A. Abah, O.T. Grace, B. Habibu, E.C. Okoli and P.U. Omajali, 2022. Risk assessment of pesticide residues in water samples from River Gongola, Adamawa State, Nigeria. World J. Adv. Res. Rev., 13: 424-432.
- Ghosh, L., S. Adhikari and S. Ayyappan, 2006. Distribution of lead, cadmium and chromium in sediment and their availability to various organs of a freshwater teleost, Labeo rohita (Hamilton). J. Fish. Aquat. Sci., 1: 200-208.
- Gudeta, B., M.V. Ratnam and R. Mohan, 2022. Physiochemical analysis of drinking water and treatment with a homemade filter: A case study of Illu Abba Bor Zone, Ethiopia. Int. J. Anal. Chem., 2022.
- Sobsey, M.D., C.E. Stauber, L.M. Casanova, J.M. Brown and M.A. Elliott, 2008. Point of use household drinking water filtration: A practical, effective solution for providing sustained access to safe drinking water in the developing world. Environ. Sci. Technol., 42: 4261-4267.
- Ndimele, P.E., A. Jenyo-Oni and C.C. Jibuike, 2009. The levels of lead (Pb) in water, sediment and a commercially important fish species (Chrysichthys nigrodigitatus) (Lacepède 1803) from Ologe Lagoon, Lagos, Nigeria. J. Environ. Ext., 8.
- Ravanipour, M., M. Hadi, N. Rastkari, S.H. Borji and S. Nasseri, 2021. Presence of heavy metals in drinking water resources of Iran: A systematic review and meta-analysis. Environ. Sci. Pollut. Res., 28: 26223-26251.
- Chen, Y.G., W.M. Ye, X.M. Yang, F.Y. Deng and Y. He, 2011. Effect of contact time, pH, and ionic strength on Cd(II) adsorption from aqueous solution onto bentonite from Gaomiaozi, China. Environ. Earth Sci., 64: 329-336.
- Devi, R., E. Alemayehu, V. Singh, A. Kumar and E. Mengistie, 2008. Removal of fluoride, arsenic and coliform bacteria by modified homemade filter media from drinking water. Bioresour. Technol., 99: 2269-2274.
- Negi, A., S.K. Joshi and N.S. Bhandari, 2023. Estimation of sorption-desorption characteristics of biosorbent of Lantana camara leaves for removal of Pb (II) ions from wastewater. Environ. Monit. Assess., 195.
- Ndimele, P.E., 2010. A review on the phytoremediation of petroleum hydrocarbon. Pak. J. Biol. Sci., 13: 715-722.
- Iheanacho, C.C., I.L. Nkwocha, T. Mgbede, M.A. Abah and A.S. Osagie et al., 2024. Physicochemical and fungal analysis of a hydrocarbon-polluted soil at Amadi-Ama Creek of Bonny River Port Harcourt, Rivers State, Nigeria. Asian J. Sci. Technol. Eng. Art, 2: 664-676.
How to Cite this paper?
APA-7 Style
Abah,
M.A., Musa,
U., Joshua,
R.A., Kama,
E.N., Obasi,
D.E., Usoh,
A.E., Etus,
P.C., Okabeonye,
S.A., Agbanigo,
B.S., Agbanigo,
U.B., Aderogba,
W.A., Bakare,
l.S., Juliet,
A.C. (2026). Physicochemical and Bacteriological Assessment of Treated and Untreated Water from Ahmadu Bello University Zaria Water Treatment Plant. Bacteriology Journal, 16(1), 1-10. https://doi.org/10.3923/bj.2026.01.10
ACS Style
Abah,
M.A.; Musa,
U.; Joshua,
R.A.; Kama,
E.N.; Obasi,
D.E.; Usoh,
A.E.; Etus,
P.C.; Okabeonye,
S.A.; Agbanigo,
B.S.; Agbanigo,
U.B.; Aderogba,
W.A.; Bakare,
l.S.; Juliet,
A.C. Physicochemical and Bacteriological Assessment of Treated and Untreated Water from Ahmadu Bello University Zaria Water Treatment Plant. Bacteriol. J 2026, 16, 1-10. https://doi.org/10.3923/bj.2026.01.10
AMA Style
Abah
MA, Musa
U, Joshua
RA, Kama
EN, Obasi
DE, Usoh
AE, Etus
PC, Okabeonye
SA, Agbanigo
BS, Agbanigo
UB, Aderogba
WA, Bakare
lS, Juliet
AC. Physicochemical and Bacteriological Assessment of Treated and Untreated Water from Ahmadu Bello University Zaria Water Treatment Plant. Bacteriology Journal. 2026; 16(1): 1-10. https://doi.org/10.3923/bj.2026.01.10
Chicago/Turabian Style
Abah, Moses, Adondua, Umar Musa, Richard Akacha Joshua, Elijah Nehemiah Kama, Daniel Ebubechi Obasi, Akon Ekpenyong Usoh, Patrick Chimuanya Etus, Sunday Agbo Okabeonye, Bolade Sunday Agbanigo, Ufuoma Blessing Agbanigo, Wasiu Adegoke Aderogba, layemi Stephen Bakare, and Agbam Chioma Juliet.
2026. "Physicochemical and Bacteriological Assessment of Treated and Untreated Water from Ahmadu Bello University Zaria Water Treatment Plant" Bacteriology Journal 16, no. 1: 1-10. https://doi.org/10.3923/bj.2026.01.10

This work is licensed under a Creative Commons Attribution 4.0 International License.